Rate of Change: Definition, Formula, and Step-by-Step Examples
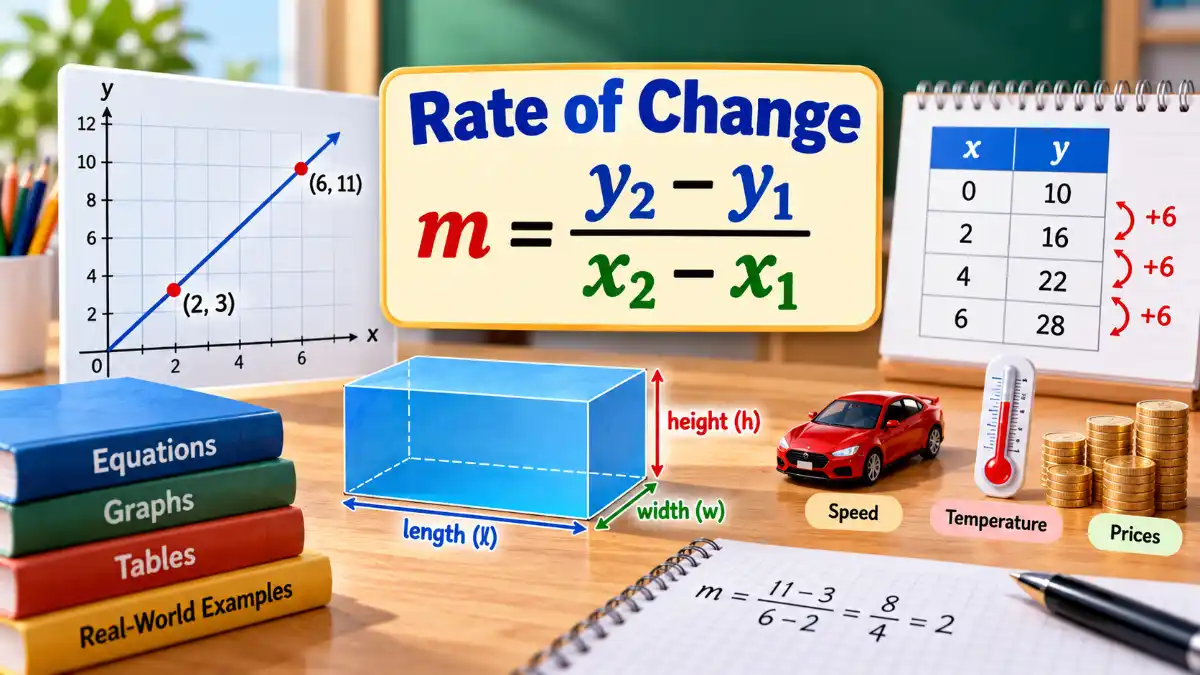
Rate of change measures how much one quantity changes in relation to another. In mathematics, you calculate it by dividing the change in output (y) by the change in input (x). For a straight line, this is also known as the slope, or rise over run. The rate of change formula is:
\[ \boxed{m=\frac{\Delta y}{\Delta x}=\frac{y_2-y_1}{x_2-x_1}} \]
Here, m represents the slope, x1 and x2 are input values, and y1 and y2 are their corresponding outputs. The Greek letter (delta) means “change in.” This relationship is the foundation of the average rate of change formula.
For example, suppose a line passes through (2, 3) and (6, 11). Its rate of change is (11-3)/(6-2)=2. In other words, every time x increases by 1 unit, y increases by 2 units.
How to Find Rate of Change
To calculate rate of change, start with two points or two sets of corresponding input and output values.
Follow these steps:
- Identify two points: Write them as (x1,y1) and (x2,y2).
- Find the change in y: Subtract y1 from y2.
- Find the change in x: Subtract x1 from x2.
- Divide: Divide the change in y by the change in x.
- Interpret the result: Determine whether the output increases, decreases, or stays constant. Include measurement units when appropriate.
The important thing is to keep your subtraction order consistent. If you subtract the first y-value from the second, do the same with the x-values. Also, the denominator cannot be zero.
Example: Rate of Change Between Two Points
Find the rate of change between (2, 3) and (6, 11).
Step 1: Identify the coordinates.
x1=2,y1=3,x2=6,y2=11
Step 2: Substitute the values into the formula.
m=11-36-2
Step 3: Simplify.
m=84=2
Answer: The rate of change is 2. The line rises 2 units vertically for every 1 unit it moves horizontally to the right.
Rate of Change Examples From Equations, Tables, and Graphs
You won’t always be given two coordinates directly. Sometimes the information appears as an equation, a table of values, or a graph. The calculation follows the same basic principle, but the way you identify the values changes.
Finding Rate of Change From a Linear Equation
A linear equation is often written in slope-intercept form:
y=mx+b
In this equation, m is the slope, while b represents the y-intercept.
Consider:
y=3x+5
The coefficient of x is 3, so the rate of change is 3. Each time x increases by 1, y increases by 3.
Because the equation represents a straight line, its rate stays the same no matter which two distinct points you choose.
Finding Rate of Change From a Table
When working with a table, choose two rows containing corresponding x and y values, then use the formula.
| x | y | Change from previous row |
| 0 | 10 | — |
| 2 | 16 | 6/2=3 |
| 4 | 22 | 6/2=3 |
| 6 | 28 | 6/2=3 |
Notice that y increases by 6 whenever x increases by 2.
m=16-102-0=62=3
The rate is 3 for every consecutive interval, so the table shows a constant rate of change.
If different intervals produce different rates, the relationship does not have a single constant rate across those intervals.
Finding Rate of Change From a Graph
To find rate of change from a graph of a straight line, first identify two points with coordinates you can read accurately.
Suppose a line passes through (1, 5) and (4, 2).
m=2-54-1=-33=-1
The slope is -1, meaning y decreases by 1 unit whenever x increases by 1 unit.
Be careful with the axis scales. One grid square might represent 1 unit, 5 units, or another interval. Reading the scale incorrectly can change your entire calculation. The rise-over-run method for finding slope helps explain how vertical and horizontal changes work together.
With a curved graph, the rate may vary depending on where you measure it. You can still calculate the average rate over an interval by finding the slope of the line connecting two points on the curve. This is called a secant line.
Positive, Negative, Zero, and Undefined Rates of Change
The slope of a straight line tells you whether y increases, decreases, or stays unchanged as x increases.
| Slope type | Meaning | Example |
| Positive | The line rises from left to right. | y=2x+1 |
| Negative | The line falls from left to right. | y=-3x+4 |
| Zero | The line is horizontal; y remains constant. | y=5 |
| Undefined | The line is vertical; the change in x is zero. | x=3 |
Zero and undefined slopes are easy to confuse, but they mean different things. A horizontal line has no vertical change, so its slope is zero. A vertical line has no horizontal change, making the denominator zero. Since division by zero is undefined, its slope is undefined too.
Constant vs. Changing Rate of Change
A constant rate of change means the output changes by the same amount whenever the input increases by equal amounts. This is a defining feature of linear functions.
Take this equation:
y=3x+5
Its rate of change is always 3, regardless of the interval you choose.
For nonlinear functions, the rate can vary. Consider:
f(x)=x2
Between x = 1 and x = 3:
f(3)-f(1)3-1=9-12=4
Now calculate the rate between x = 3 and x = 5:
f(5)-f(3)5-3=25-92=8
The average rate increases from 4 to 8. Although both intervals have the same width, the function changes more rapidly over the second interval.
Average vs. Instantaneous Rate of Change
Average and instantaneous rates both describe how a function changes, but they answer slightly different questions.
Average Rate of Change
The average rate of change measures the overall change in a function between two input values.
Its formula is:
f(b)-f(a)b-a
Here, a and b represent two distinct input values.
On a graph, this is the slope of the secant line connecting the corresponding points on the function.
For example, for f(x)=x2 between x = 1 and x = 3, the average rate is 4.
Instantaneous Rate of Change
The instantaneous rate of change tells you how quickly a function changes at a particular input value rather than across an interval.
In calculus, this is expressed using a derivative, provided the derivative exists at that point:
f'(a)=h0f(a+h)-f(a)h
Geometrically, the derivative gives the slope of the tangent line at that point.
For f(x)=x2, the derivative is f'(x)=2x. At x = 3, the instantaneous rate is 6.
The distinction is simple: an average rate describes what happens over an interval, while an instantaneous rate describes what happens at one point.
Real-World Applications of Rate of Change
Rate of change is useful whenever you want to understand how one measurable quantity changes relative to another.
Speed: Suppose a vehicle travels 120 miles in 2 hours. Its average speed is:
120miles2hours=60mph
That means the vehicle covered an average of 60 miles per hour. It doesn’t necessarily mean the driver maintained exactly 60 mph throughout the trip.
Temperature: If the temperature rises from 50°F to 65°F over 3 hours, the average rate is:
\[ \frac{65-50}{3}=5^\circ\text{F per hour} \]
Prices: Imagine a product’s price increases from $40 to $50 over 2 years. Its average rate of change is $5 per year.
This example also shows why rate of change shouldn’t be confused with percentage change. The total percentage increase is:
\[ \frac{50-40}{40}\times100=25\% \]
Both calculations describe the increase, but in different ways. The first gives the average dollar increase per year, while the second expresses the total increase as a percentage of the original price.
Common Mistakes When Calculating Rate of Change
Even when you know the formula, a small mistake can lead to the wrong result. These are some common errors to watch for:
- Reversing subtraction inconsistently: If you calculate y2-y1, you must also use x2-x1, not x1-x2.
- Misreading graph scales: Check the axis labels and increments before choosing coordinates.
- Dividing by zero: When the two input values are identical, the two-point slope formula is undefined.
- Forgetting units: A result of 5 might represent 5 miles per hour, 5°F per hour, or another unit, depending on the quantities involved.
- Confusing average and instantaneous rates: The average describes change over an interval, while the instantaneous rate describes change at a particular point.
- Mistaking rate of change for percentage change: For a rate, divide the change in output by the change in input. Don’t automatically divide by the starting output value.
Read Also: Rate of Change
Frequently Asked Questions
The rate of change formula is:
y2-y1x2-x1
It measures the change in output divided by the change in input. For a straight line, the result is its slope.
Subtract the first y-coordinate from the second, then divide by the difference between the corresponding x-coordinates. For example, between (1, 2) and (4, 8), the rate is (8-2)/(4-1)=2.
For a linear function, yes. The slope represents its constant rate of change. For a nonlinear function, the average rate of change is the slope of a secant line, while the instantaneous rate is the slope of a tangent line where the derivative exists.
Yes. A negative rate means the output decreases as the input increases. For example, a temperature drop of 12°F over 3 hours gives an average rate of -4°F per hour.
A zero rate means there is no net change in output over the measured interval. For a straight line with zero slope, the output remains constant as the input changes.
Rate of change measures the change in one quantity relative to a change in another, such as dollars per year. Percentage change measures the increase or decrease relative to the original value and expresses it as a percentage.